

Psychrometric charts
A psychrometric chart for sea-level elevation
Terminology
A psychrometric chart is a graph of the thermodynamic parameters of moist air at a constant pressure, often equated to an elevation relative to sea level. The ASHRAE-style psychrometric chart, shown here, was pioneered by Willis Carrier in 1904. It depicts these parameters and is thus a graphical equation of state. The parameters are:
Dry-bulb temperature (DBT) is that of an air sample, as determined by an ordinary thermometer. It is typically plotted as the abscissa (horizontal axis) of the graph. The SI units for temperature are kelvins or degrees Celsius; other units are degrees Fahrenheit and degrees Rankine.
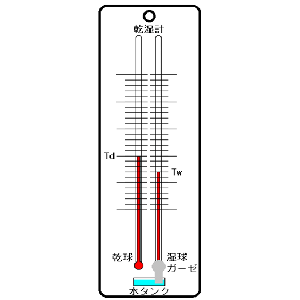
Wet-bulb temperature (WBT) is that of an air sample after it has passed through a constant-pressure, ideal, adiabatic saturation process, that is, after the air has passed over a large surface of liquid water in an insulated channel. In practice this is the reading of a thermometer whose sensing bulb is covered with a wet sock evaporating into a rapid stream of the sample air (see Hygrometer). When the air sample is saturated with water, the WBT will read the same as the DBT. The slope of the line of constant WBT reflects the heat of vaporization of the water required to saturate the air of a given relative humidity.
Dew point temperature (DPT) is the temperature at which a moist air sample at the same pressure would reach water vapor “saturation.” At this point further removal of heat would result in water vapor condensing into liquid water fog or, if below freezing point, solid hoarfrost. The dew point temperature is measured easily and provides useful information, but is normally not considered an independent property of the air sample as it duplicates information available via other humidity properties and the saturation curve.
Relative humidity (RH) is the ratio of the mole fraction of water vapor to the mole fraction of saturated moist air at the same temperature and pressure. RH is dimensionless, and is usually expressed as a percentage. Lines of constant RH reflect the physics of air and water: they are determined via experimental measurement. The concept that air “holds” moisture, or that moisture “dissolves” in dry air and saturates the solution at some proportion, is erroneous (albeit widespread); see relative humidity for further details.
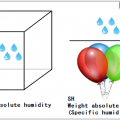
Humidity ratio is the proportion of mass of water vapor per unit mass of dry air at the given conditions (DBT, WBT, DPT, RH, etc.). It is also known as the moisture content or mixing ratio. It is typically plotted as the ordinate (vertical axis) of the graph. For a given DBT there will be a particular humidity ratio for which the air sample is at 100% relative humidity: the relationship reflects the physics of water and air and must be determined by measurement. The dimensionless humidity ratio is typically expressed as grams of water per kilogram of dry air, or grains of water per pound of air (7000 grains equal 1 pound).
Specific enthalpy, symbolized by h, is the sum of the internal (heat) energy of the moist air in question, including the heat of the air and water vapor within. Also called heat content per unit mass. In the approximation of ideal gases, lines of constant enthalpy are parallel to lines of constant WBT. Enthalpy is given in (SI) joules per kilogram of air, or BTU per pound of dry air.
Specific volume is the volume of the mixture (dry air plus the water vapor) containing one unit of mass of “dry air”. The SI units are cubic meters per kilogram of dry air; other units are cubic feet per pound of dry air. The inverse of specific volume is usually confused as the density of the mixture (see “Applying the Psychrometric Relationships” CIBSE, August 2009). However, to obtain the actual mixture density one must multiply the inverse of the specific volume by unity plus the humidity ratio value at the point of interest (see ASHRAE Fundamentals 1989 6.6, equation 9).
The psychrometric chart allows all the parameters of some moist air to be determined from any three independent parameters, one of which must be the pressure. Changes in state, such as when two air streams mix, can be modeled easily and somewhat graphically using the correct psychrometric chart for the location’s air pressure or elevation relative to sea level. For locations at not more than 2000 ft (600 m) of altitude it is common practice to use the sea-level psychrometric chart.
In the ω-t chart, the dry bulb temperature (t) appears as the abscissa (horizontal axis) and the humidity ratio (ω) appear as the ordinate (vertical axis). A chart is valid for a given air pressure (or elevation above sea level). From any two independent ones of the six parameters dry bulb temperature, wet bulb temperature, relative humidity, humidity ratio, specific enthalpy, and specific volume, all the others can be determined.
There are
![]()
![]()
possible combinations of independent and derived parameters.
Locating parameters on chart
* Dry bulb temperature (green): These lines are drawn straight, not always parallel to each other, and slightly inclined from the vertical position. This is the t–axis, the abscissa (horizontal) axis. Each line represents a constant temperature.
* Dew point temperature: From the state point follow the horizontal line of constant humidity ratio to the intercept of 100% RH, also known as the saturation curve. The dew point temperature is equal to the fully saturated dry bulb or wet bulb temperatures.
* Wet bulb temperature (blue): These lines are oblique lines that differ slightly from the enthalpy lines. They are identically straight but are not exactly parallel to each other. These intersect the saturation curve at DBT point.
* Relative humidity (red ): These hyperbolic lines are shown in intervals of 10%. The saturation curve is at 100% RH, while dry air is at 0% RH.
* Humidity ratio (navy blue): These are the horizontal lines on the chart. Humidity ratio is usually expressed as mass of moisture per mass of dry air (pounds or kilograms of moisture per pound or kilogram of dry air, respectively). The range is from 0 for dry air up to 0.03 (lbmw/lbma) on the right hand ω-axis, the ordinate or vertical axis of the chart.
* Specific enthalpy (black): These are oblique lines drawn diagonally downward from left to right across the chart that are parallel to each other. These are not parallel to wet bulb temperature lines.
*Specific volume (green): These are a family of equally spaced straight lines that are nearly parallel.
The region above the saturation curve is a two-phase region that represents a mixture of saturated moist air and liquid water, in thermal equilibrium.
The protractor on the upper left of the chart has two scales. The inner scale represents sensible-total heat ratio (SHF). The outer scale gives the ratio of enthalpy difference to humidity difference. This is used to establish the slope of a condition line between two processes. The horizontal component of the condition line is the change in sensible heat while the vertical component is the change in latent heat.[10][11][12]
How to read the chart: fundamental examples
Psychrometric charts are available in SI (metric) and IP (U.S./English) units. They are also available in low and high temperature ranges and for different pressures.
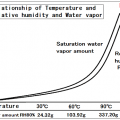
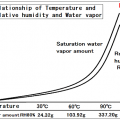
(1) Determining relative humidity: The percent relative humidity can be located at the intersection of the horizontal dry bulb and diagonally down sloping wet bulb temperature lines. Metric (SI): Using a dry bulb of 25°C and a wet bulb of 20°C, read the relative humidity at approximately 63.5%. English/U.S (IP): Using a dry bulb of 77°F and a wet bulb of 68°F, read the relative humidity at approximately 63.5%. In this example the humidity ratio is 0.0126 kg water per kg dry air.
(2) Determining the effect of temperature change on relative humidity: For air of a fixed water composition or moisture ratio, find the starting relative humidity from the intersection of the wet and dry bulb temperature lines. Using the conditions from the previous example, the relative humidity at a different dry bulb temperatures can be found along the horizontal humidity ratio line of 0.0126, either in kg water per kg dry air or pounds water per pound dry air.
A common variation of this problem is determining the final humidity of air leaving an air conditioner evaporator coil then heated to a higher temperature. Assume that the temperature leaving the coil is 10°C (50°F) and is heated to room temperature (not mixed with room air), which is found by following the horizontal humidity ratio from the dew point or saturation line to the room dry bulb temperature line and reading the relative humidity. In typical practice the conditioned air is mixed with room air that is being infiltrated with outside air.
(3) Determining the amount of water to be removed or added in lowering or raising relative humidity: This is the difference in humidity ratio between the initial and final conditions times the weight of dry air.